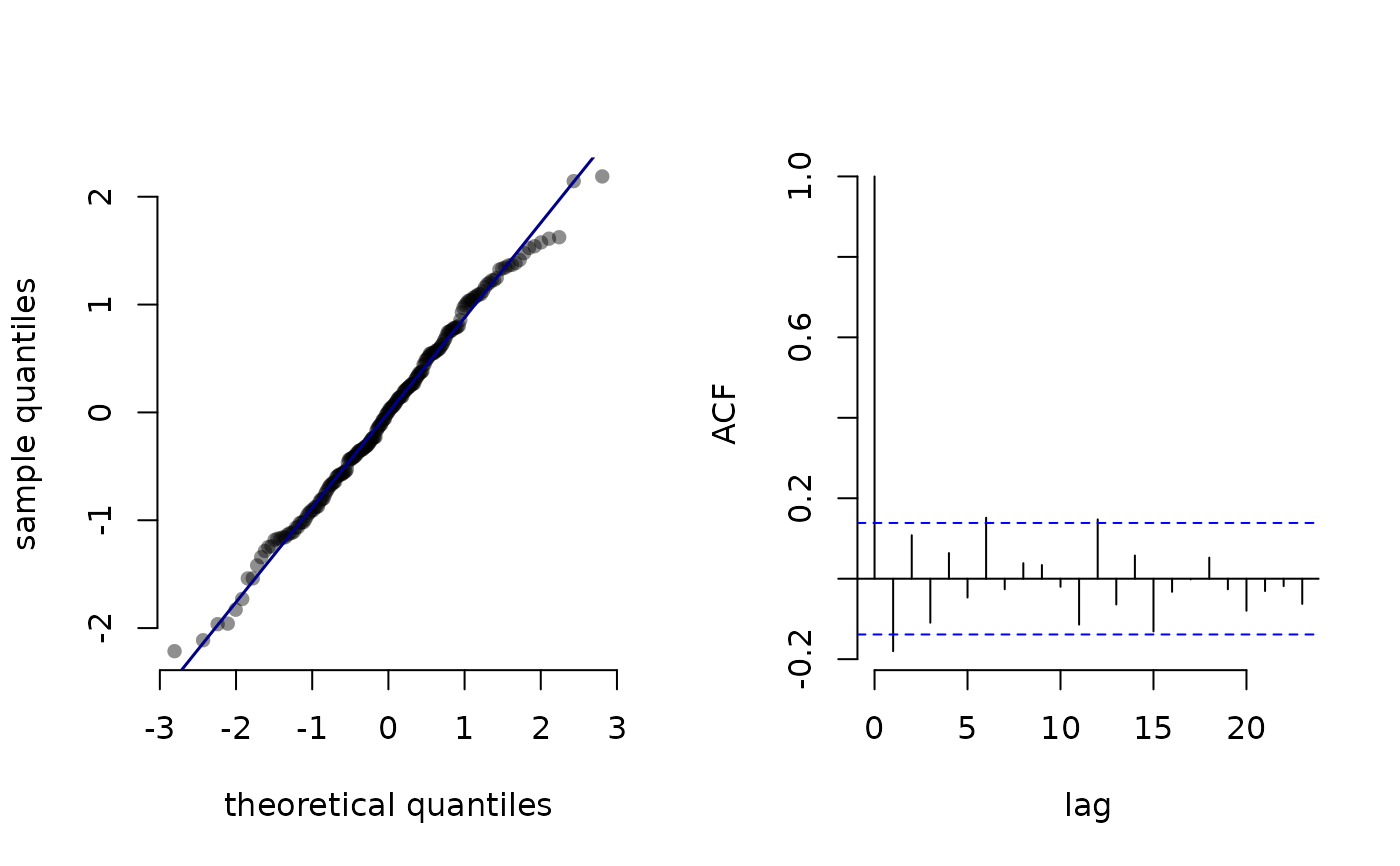
Plot pseudo-residuals
plot.LaMaResiduals.RdPlot pseudo-residuals computed by pseudo_res.
Usage
# S3 method for class 'LaMaResiduals'
plot(x, hist = TRUE, col = "darkblue", lwd = 1.5, main = NULL, ...)
Arguments
- x
pseudo-residuals as returned by
pseudo_res- hist
logical, if
TRUE, adds a histogram of the pseudo-residuals- col
character, color for the QQ-line (and density curve if
histogram = TRUE)- lwd
numeric, line width for the QQ-line (and density curve if
histogram = TRUE)- main
optional character vector of main titles for the plots of length 2 (or 3 if
histogram = TRUE)- ...
currently ignored. For method consistency
Examples
## pseudo-residuals for the trex data
step = trex$step[1:200]

nll = function(par){
  getAll(par)
  Gamma = tpm(logitGamma)
  delta = stationary(Gamma)
  mu = exp(logMu); REPORT(mu)
  sigma = exp(logSigma); REPORT(sigma)
  allprobs = matrix(1, length(step), 2)
  ind = which(!is.na(step))
  for(j in 1:2) allprobs[ind,j] = dgamma2(step[ind], mu[j], sigma[j])
  -forward(delta, Gamma, allprobs)
}

par = list(logitGamma = c(-2,-2),
           logMu = log(c(0.3, 2.5)),
           logSigma = log(c(0.3, 0.5)))

obj = MakeADFun(nll, par)
#> Performance tip: Consider running `TapeConfig(matmul = 'plain')` before `MakeADFun()` to speed up the forward algorithm.
opt = nlminb(obj$par, obj$fn, obj$gr)
#> outer mgc:  336.5166
#> outer mgc:  20.97319
#> outer mgc:  34.15246
#> outer mgc:  19.14836
#> outer mgc:  22.89668
#> outer mgc:  14.22144
#> outer mgc:  16.43229
#> outer mgc:  8.153913
#> outer mgc:  6.812466
#> outer mgc:  9.6369
#> outer mgc:  12.03652
#> outer mgc:  3.217212
#> outer mgc:  3.933861
#> outer mgc:  3.111364
#> outer mgc:  2.511187
#> outer mgc:  3.259669
#> outer mgc:  1.203184
#> outer mgc:  0.9612578
#> outer mgc:  1.247134
#> outer mgc:  1.783606
#> outer mgc:  1.46798
#> outer mgc:  0.7872239
#> outer mgc:  0.06505949
#> outer mgc:  0.1913509
#> outer mgc:  0.06904775
#> outer mgc:  0.1037367
#> outer mgc:  0.01007877
#> outer mgc:  0.002057908
#> outer mgc:  0.0002424967

mod = obj$report()

pres = pseudo_res(step, "gamma2", list(mean = mod$mu, sd = mod$sigma),
                  mod = mod)

plot(pres)
